RuledPaper
Free printable · PDF, PNG, SVG
Logarithmic Graph Paper (Semi-Log and Log-Log)
Logarithmic graph paper spaces grid lines according to a log scale, so each cycle on the axis covers a factor of ten: 1 to 10, 10 to 100, and so on. On semi-log paper one axis is logarithmic and the other is linear; on log-log paper both are. Science and engineering students use it to turn exponential and power-law data into straight lines.
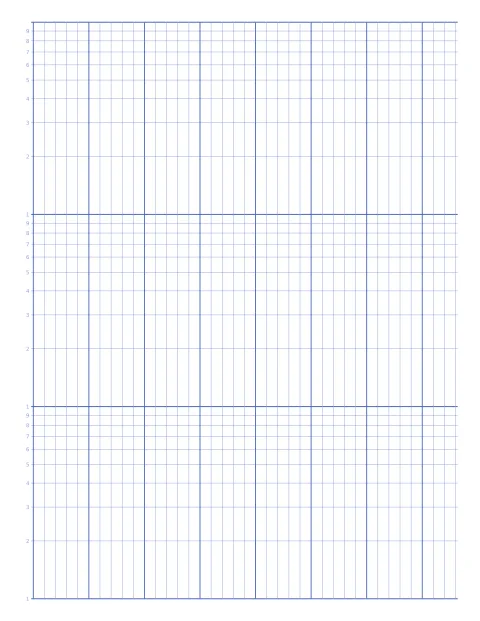
Preview of page 1. 215.9 mm × 279.4 mm. Print at 100% (“Actual size”) to keep the spacing exact.
What people use it for
- Plotting exponential growth and decay, such as bacteria or radioactive decay
- Frequency response and Bode plots in electronics
- Power-law relationships in physics and biology
- Data that spans several orders of magnitude, like earthquake or sound energy
- Particle size distribution and grading curves in civil engineering
Standard measurements
| One cycle (decade) | A tenfold range, for example 1 to 10 |
|---|---|
| Semi-log | One logarithmic axis, one linear axis |
| Log-log | Both axes logarithmic |
Tips for log graph paper
- Count how many powers of ten your data covers and choose at least that many cycles; values from 2 to 5,000 need four cycles.
- Use semi-log paper when one quantity grows by a constant percentage over time, and log-log when both quantities follow a power law.
- Remember there is no zero on a log axis. Label the first line of each cycle with 1, 10, 100 and so on.
- Print landscape for time series with many points along the linear axis.
Printing tip: in the print dialog choose Actual size or 100%, not “Fit to page”, or the spacing shrinks slightly. How we keep sizes exact.
Questions
What is semi-log graph paper used for?
It turns exponential relationships into straight lines. If data plotted with a log y-axis and linear x-axis falls on a line, the quantity is growing or shrinking at a constant rate.
What does a straight line on log-log paper mean?
It means the two quantities follow a power law, y = a x to the power b. The slope of the line equals the exponent b.
Why is there no zero on a log scale?
The logarithm of zero is undefined: you can get closer and closer to zero by adding cycles, but never reach it. Each cycle down divides by ten.
How do I read values between the grid lines?
Within a cycle, lines are labelled 1 to 9 times the cycle's starting value. The gaps shrink toward the top of each cycle, so estimate positions carefully or use a log ruler.